
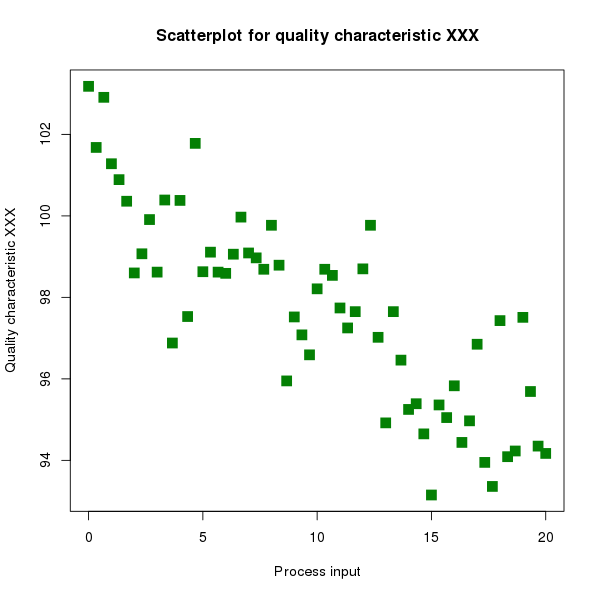
 A Scatter Plot displays a collection of points representing a set of data defined by two variables. One variable, usually independent, on the horizontal axis and the second dependent variable on the vertical axis.
http://en.wikipedia.org/wiki/Scatter_plot
No comments:
Post a Comment