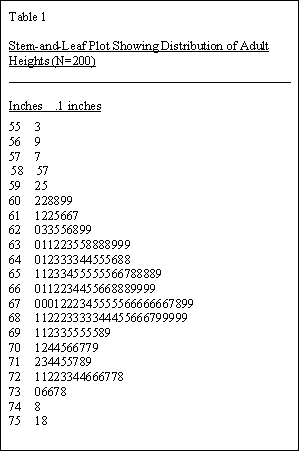
This is a Stem and Leaf plot graph that the distribution of adult heights for a certain data set. This normal distribution set shows that the adults are average roughly 67 inches tall and as the number of inches decreases and increases, the amount of people at that height decreases. Stem and Leaf plots are used to express quantitative data in a graph.
http://nyjm.albany.edu:8000/~reinhold/m308/Assgnmt1_HowTo.htm

No comments:
Post a Comment